I wonder when the cherry blossoms will strike?
library(readr)
library(dplyr)
library(ggplot2)
# getting data from
# https://www.epa.gov/sites/production/files/2016-08/cherry-blossoms_fig-1.csv
#
set.seed(123)
cherry = readr::read_csv('../../data/cherry.csv', skip = 6)
cherry = cherry %>%
# adding the latest year (2017) data
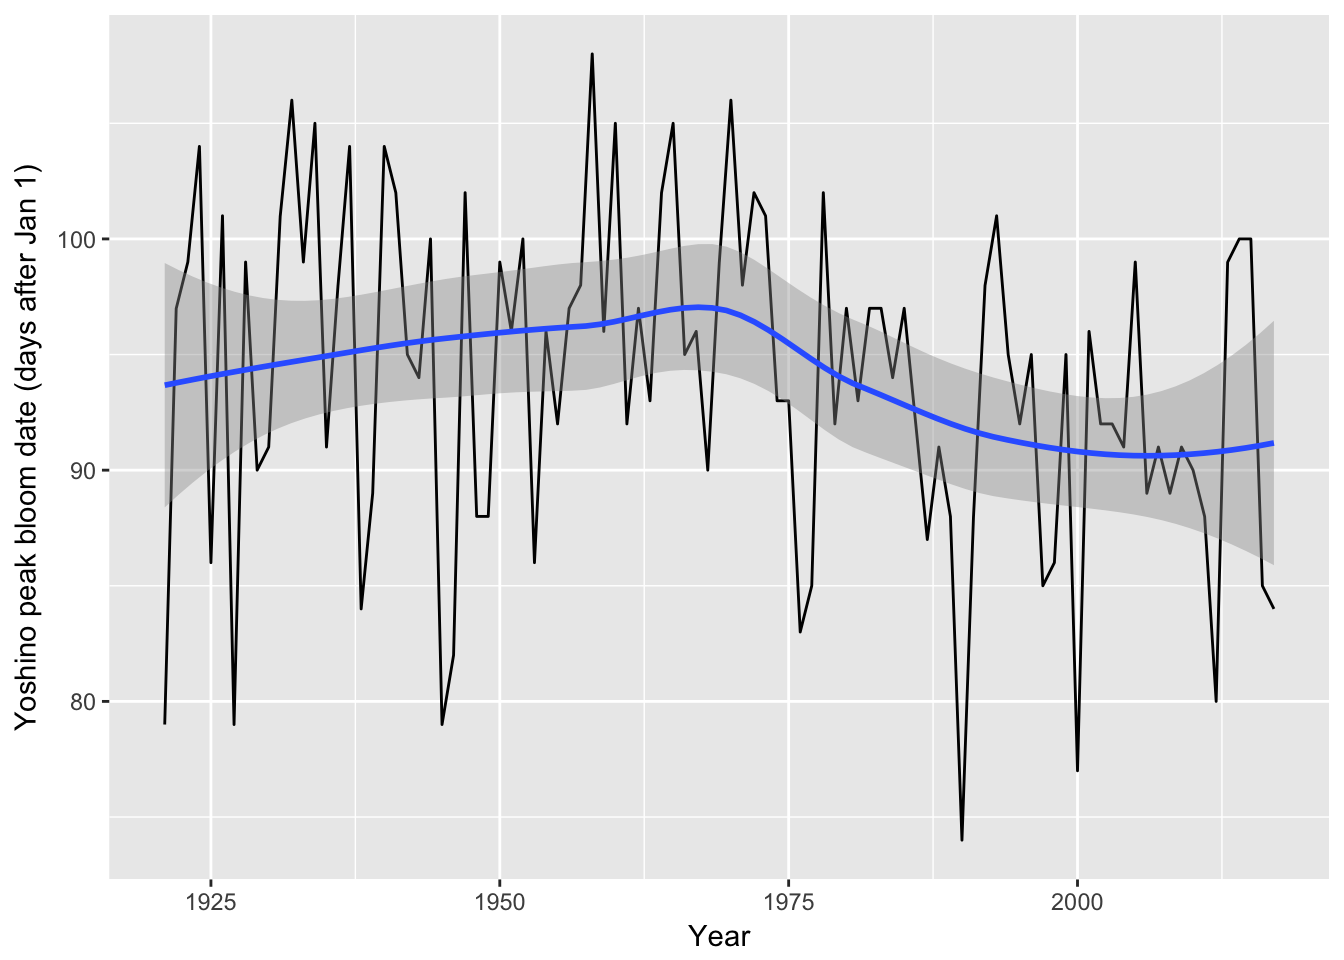
rbind(c(2017,84,NA))cherry %>% ggplot(aes(Year, `Yoshino peak bloom date`)) +
geom_line() +
geom_smooth() +
ylab('Yoshino peak bloom date (days after Jan 1)')